User Guide
This guide walks you through the core workflows in AttoPhase: creating and linking elements (risks, requirements, tests, and test results), viewing traceability tables, importing and exporting data, and managing reviews.
1. Creating a risk
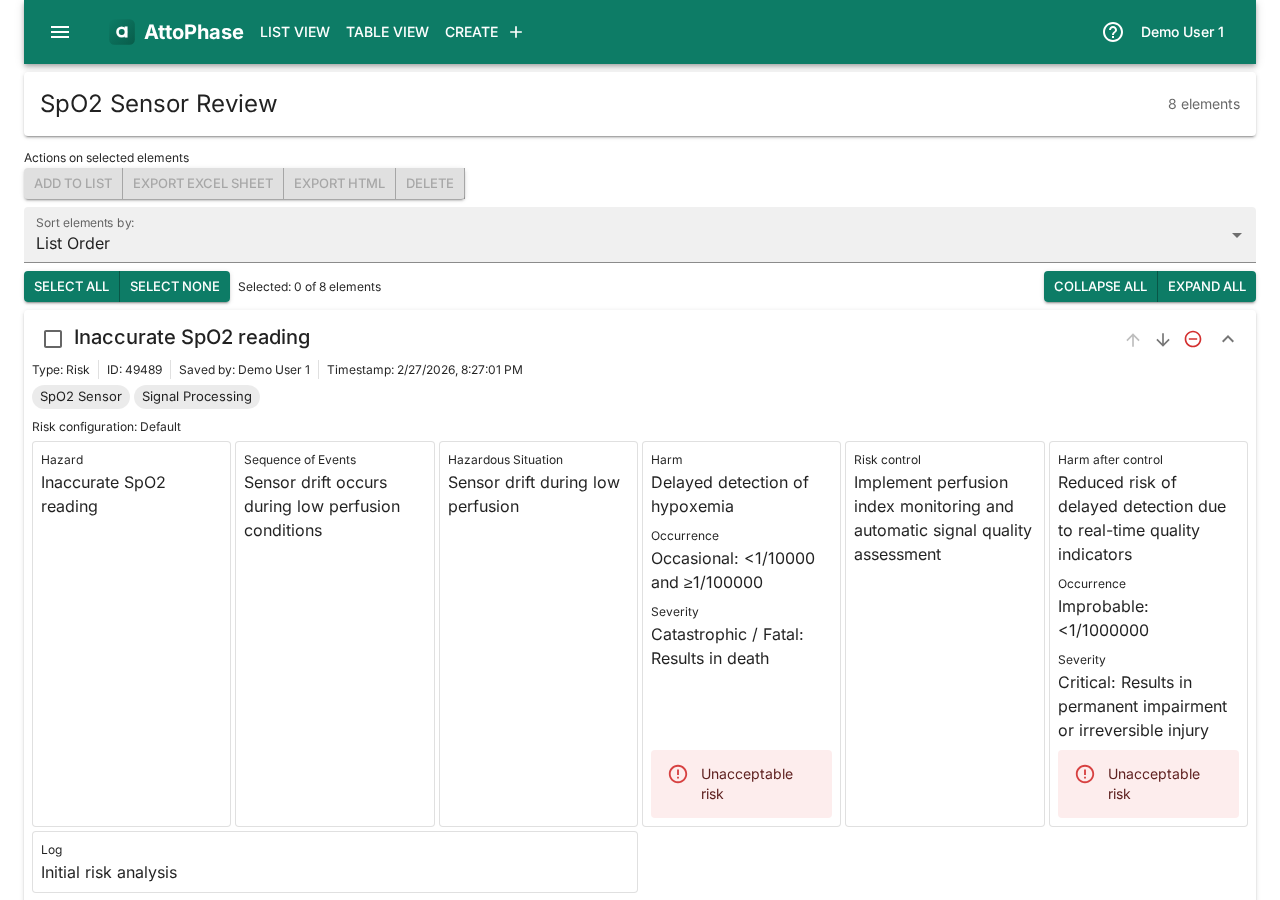
Risks follow the ISO 14971 standard structure. AttoPhase comes with a default 5×5 risk matrix, but you can configure your own. In this example we create a risk for an inaccurate SpO2 reading in a pulse oximeter.
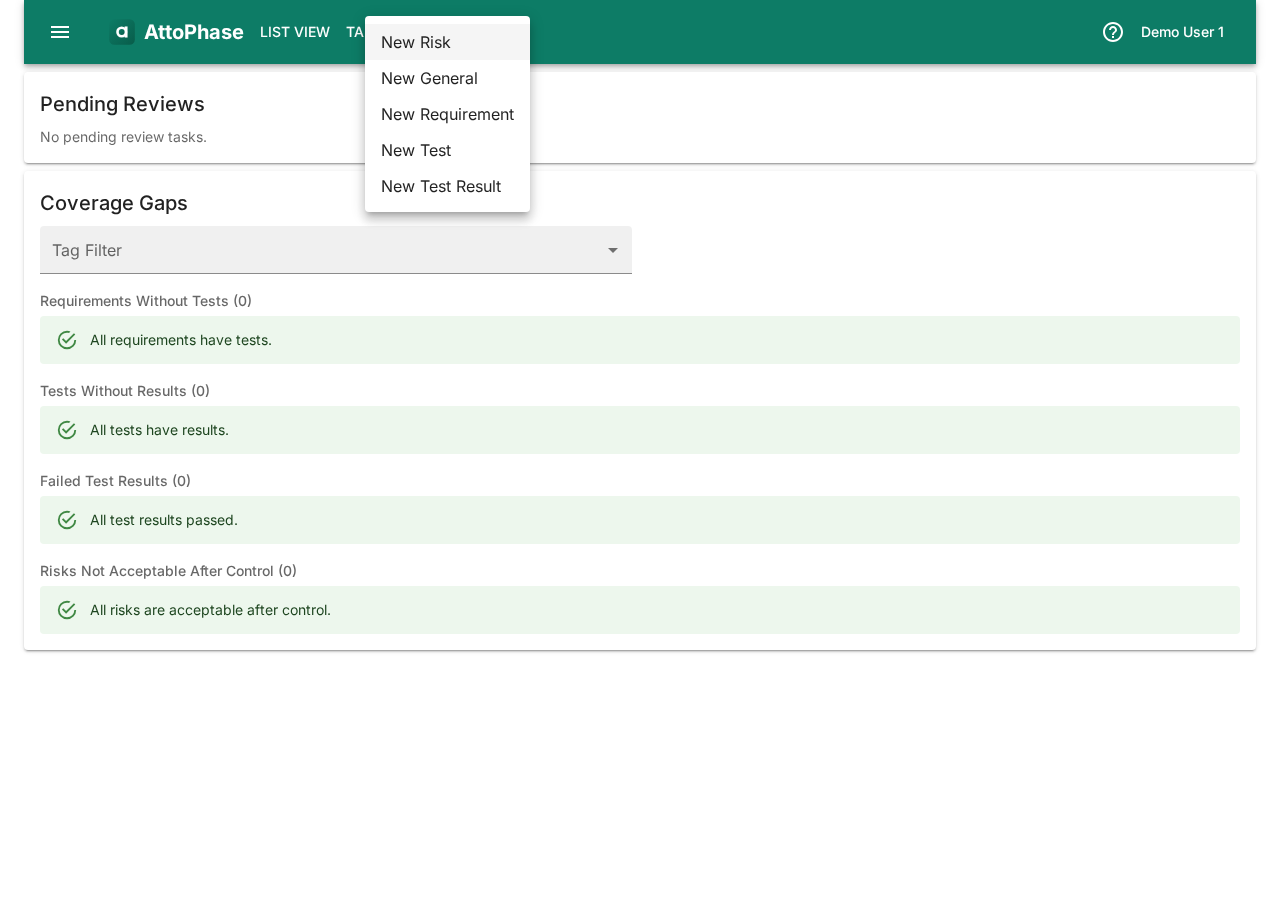
- Click the Create button in the toolbar.
- Select New Risk from the dropdown menu.
Set up the risk:
- Select a Risk Configuration (e.g. "Default" for the ISO 14971 5×5 matrix).
- Enter a Name — e.g. "Inaccurate SpO2 reading".
Fill in the risk analysis fields:
- Fill in the Hazard field — "Inaccurate SpO2 reading".
- Describe the Sequence of Events — "Sensor drift occurs during low perfusion conditions".
- Describe the Hazardous Situation — "Sensor drift during low perfusion".
- Describe the Harm — "Delayed detection of hypoxemia".
- Set the Occurrence and Severity ratings. The risk level is calculated automatically from the matrix.
Add risk control measures:
- Enter the Risk Control measure — e.g. "Implement perfusion index monitoring and automatic signal quality assessment".
- Fill in the Harm after Control, and set the post-control Occurrence and Severity to see the residual risk level.
- Add Tags to categorize the risk (e.g. "SpO2 Sensor", "Signal Processing").
- Write a Log note describing the change — e.g. "Initial risk analysis".
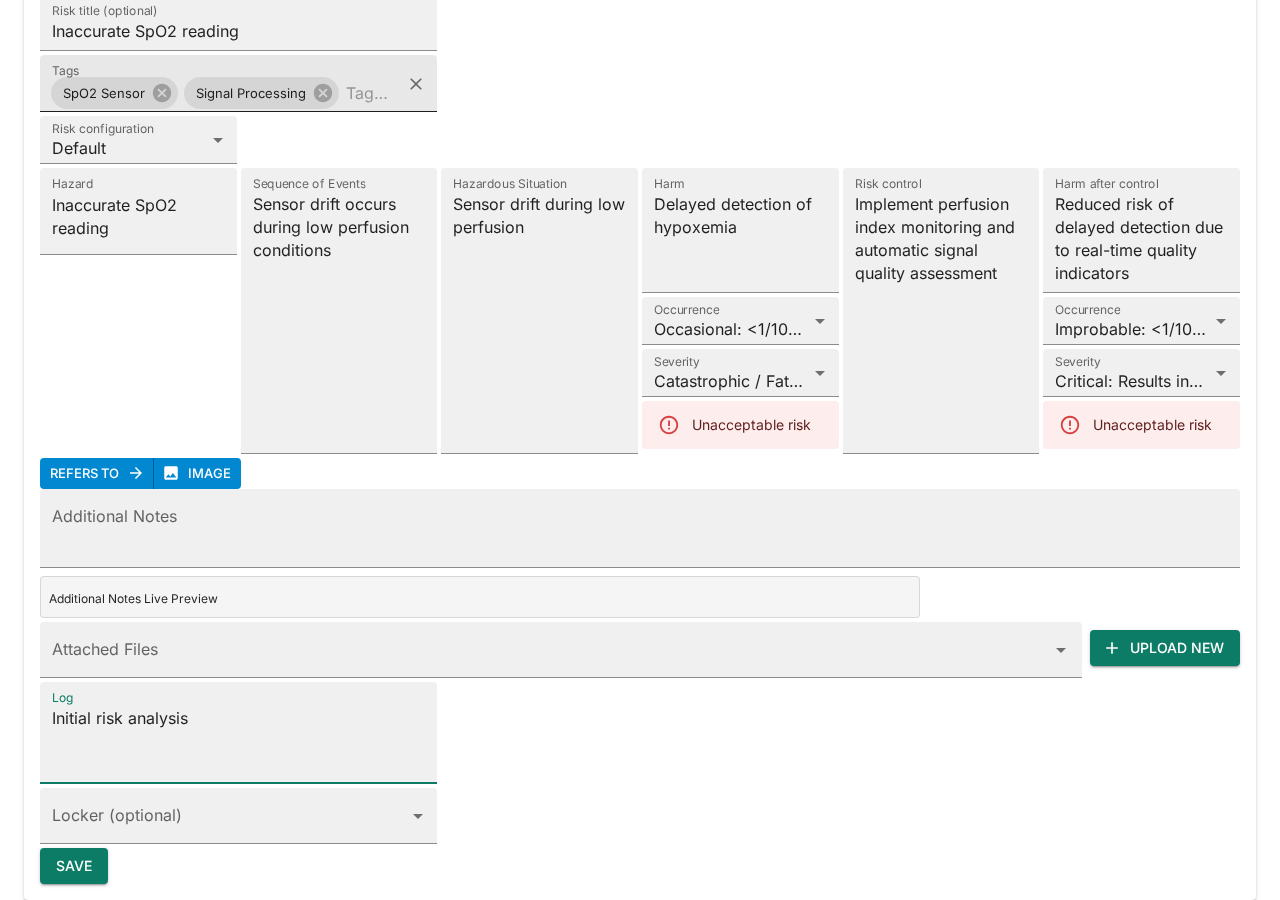
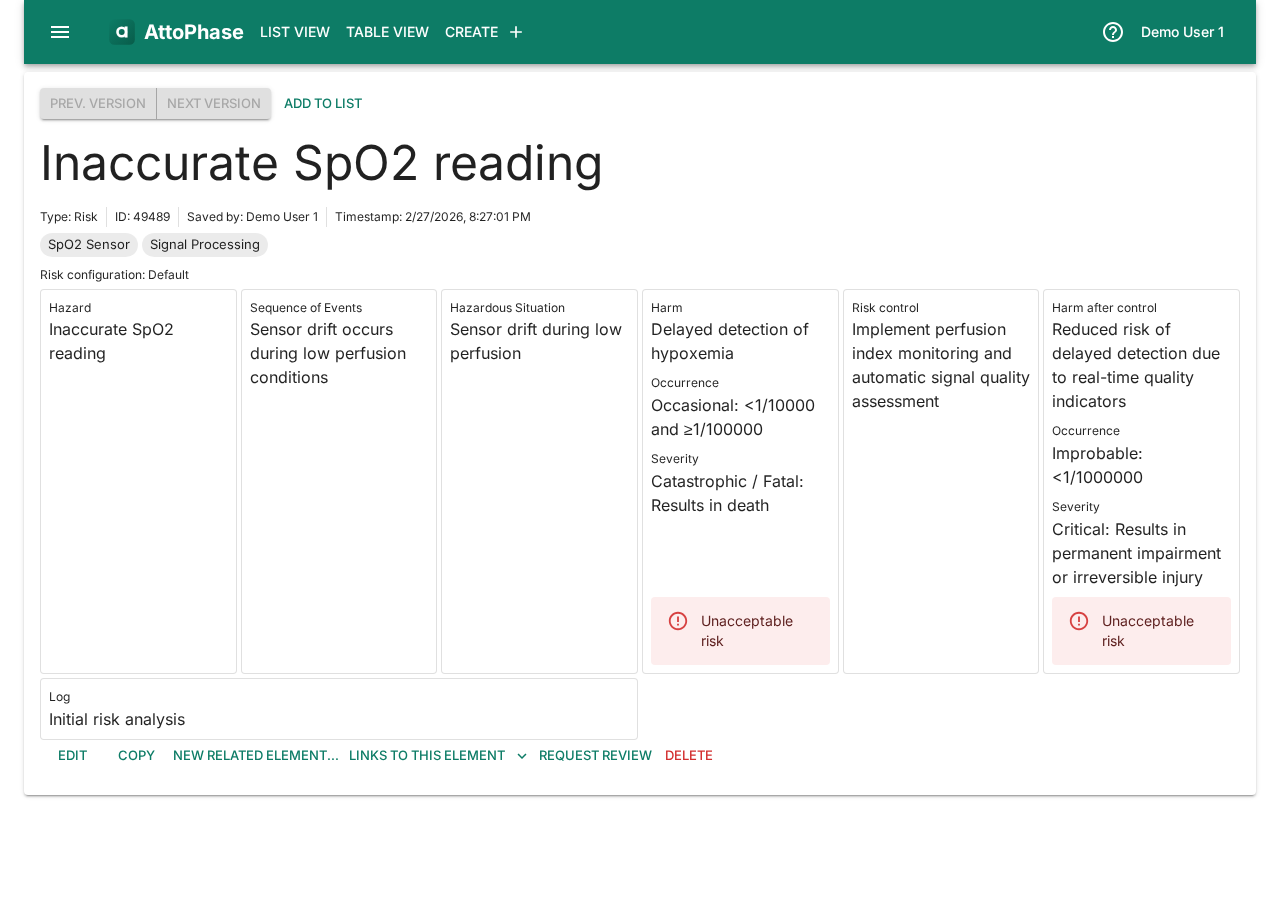
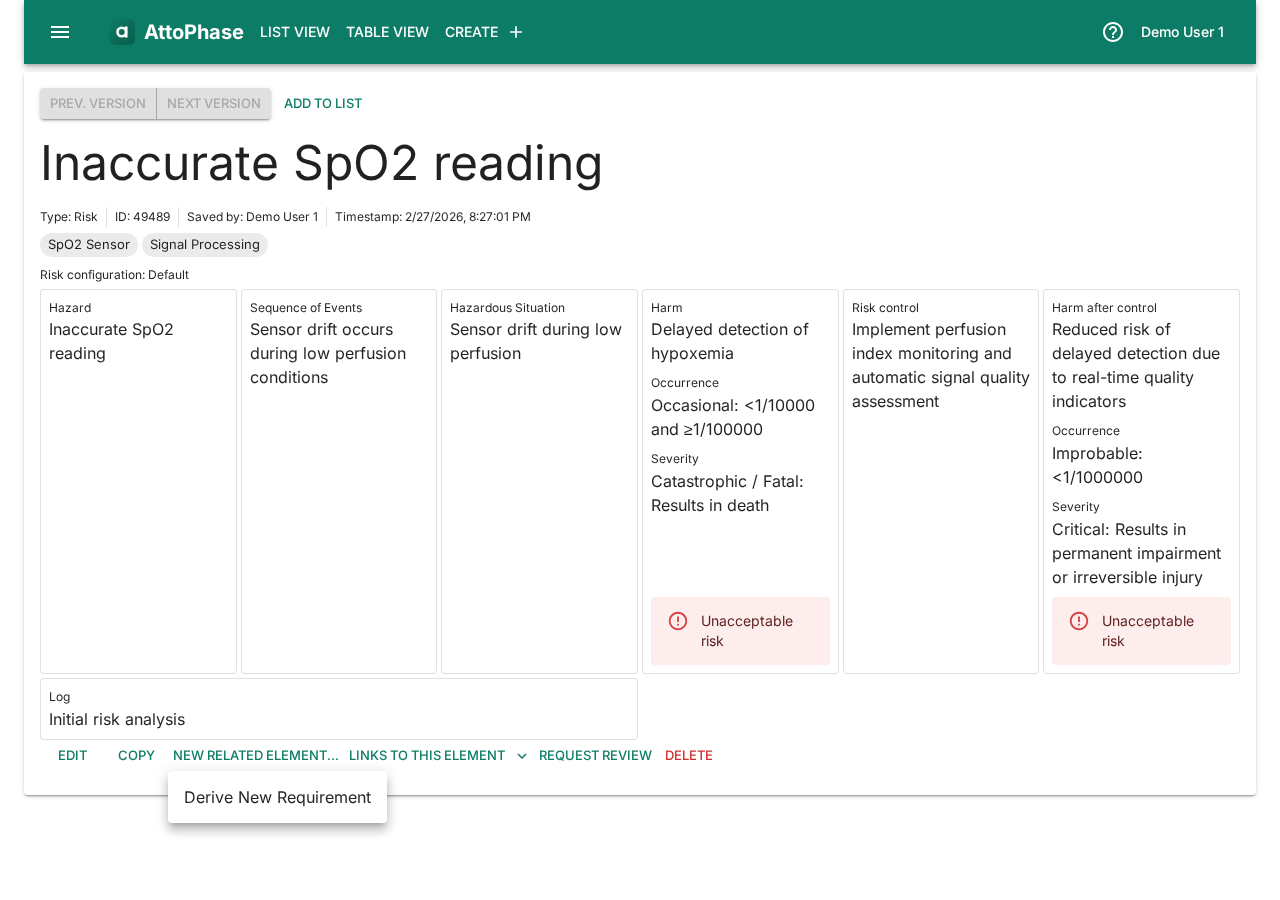
- Click Save. You are taken to the risk detail view showing all the information you entered, including the calculated risk levels before and after control.
2. Deriving a requirement from a risk
Requirements are typically derived from risks to ensure each identified hazard is addressed. AttoPhase automatically creates a traceability link between the risk and the requirement.
- Navigate to the risk you want to derive a requirement from (e.g. "Inaccurate SpO2 reading").
- Click the New related element... button.
- Select Derive New Requirement from the menu.
- A dialog opens with a pre-populated link back to the risk in the Text field. Enter the requirement Name — e.g. "SpO2 accuracy ±2% over 70-100% range".
- Add the requirement description in the Text field — e.g. "The sensor shall measure SpO2 within ±2% of arterial blood gas reference across the 70-100% SpO2 range".
- Add Tags and a Log note.
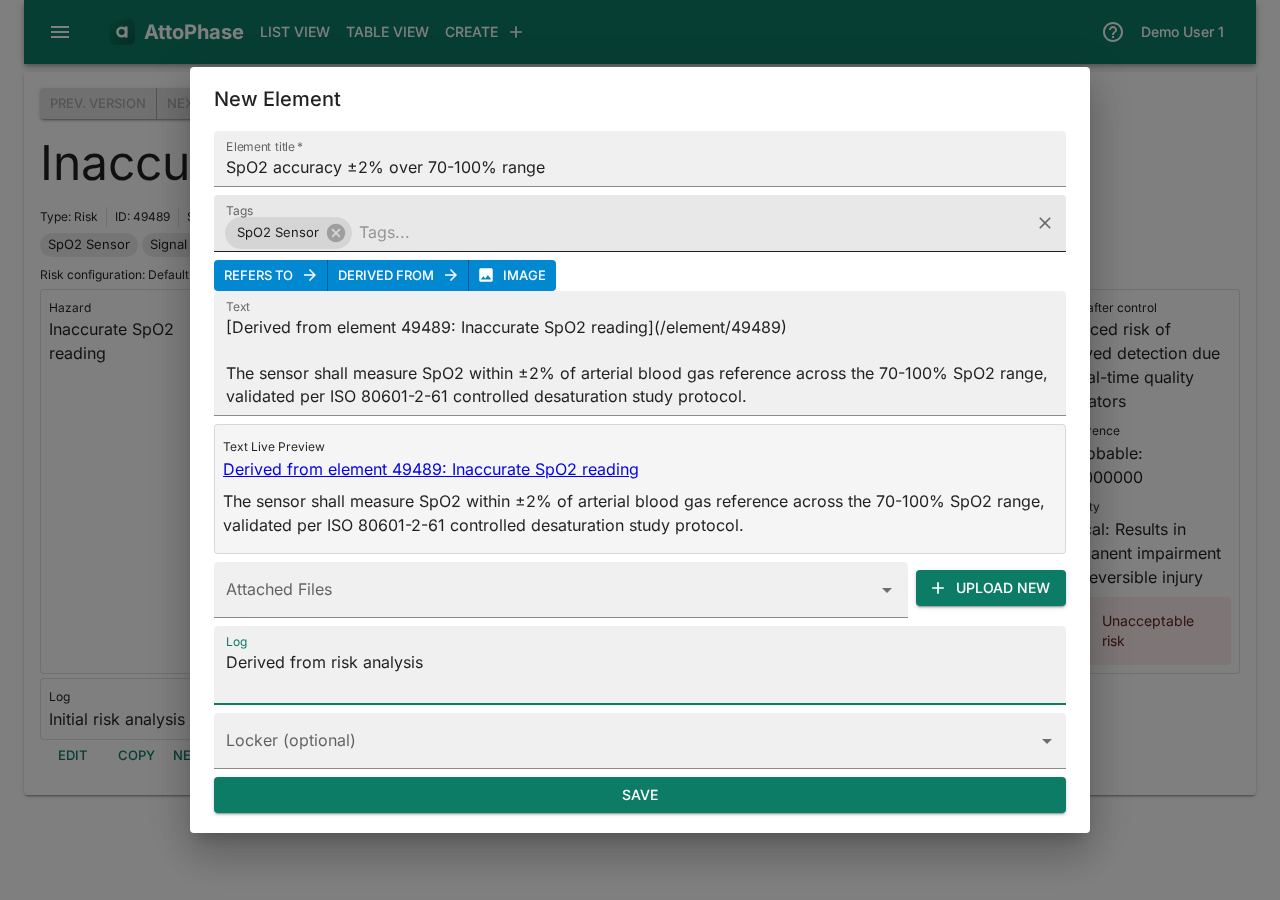
- Click Save. The requirement is created with a traceability link to the risk automatically established.
3. Defining a test for a requirement
Each requirement should have one or more tests to verify it. The process is the same as deriving a requirement, but from a requirement's detail page.
- Navigate to the requirement (e.g. "SpO2 accuracy ±2% over 70-100% range").
- Click New related element... > Define Test.
- The dialog pre-populates a reference link to the requirement. Enter the test Name — e.g. "SpO2 accuracy bench test".
- Describe the test protocol in the Text field — e.g. "Measure SpO2 against controlled desaturation study data at 5% SpO2 increments from 70% to 100%".
- Add Tags and a Log note.
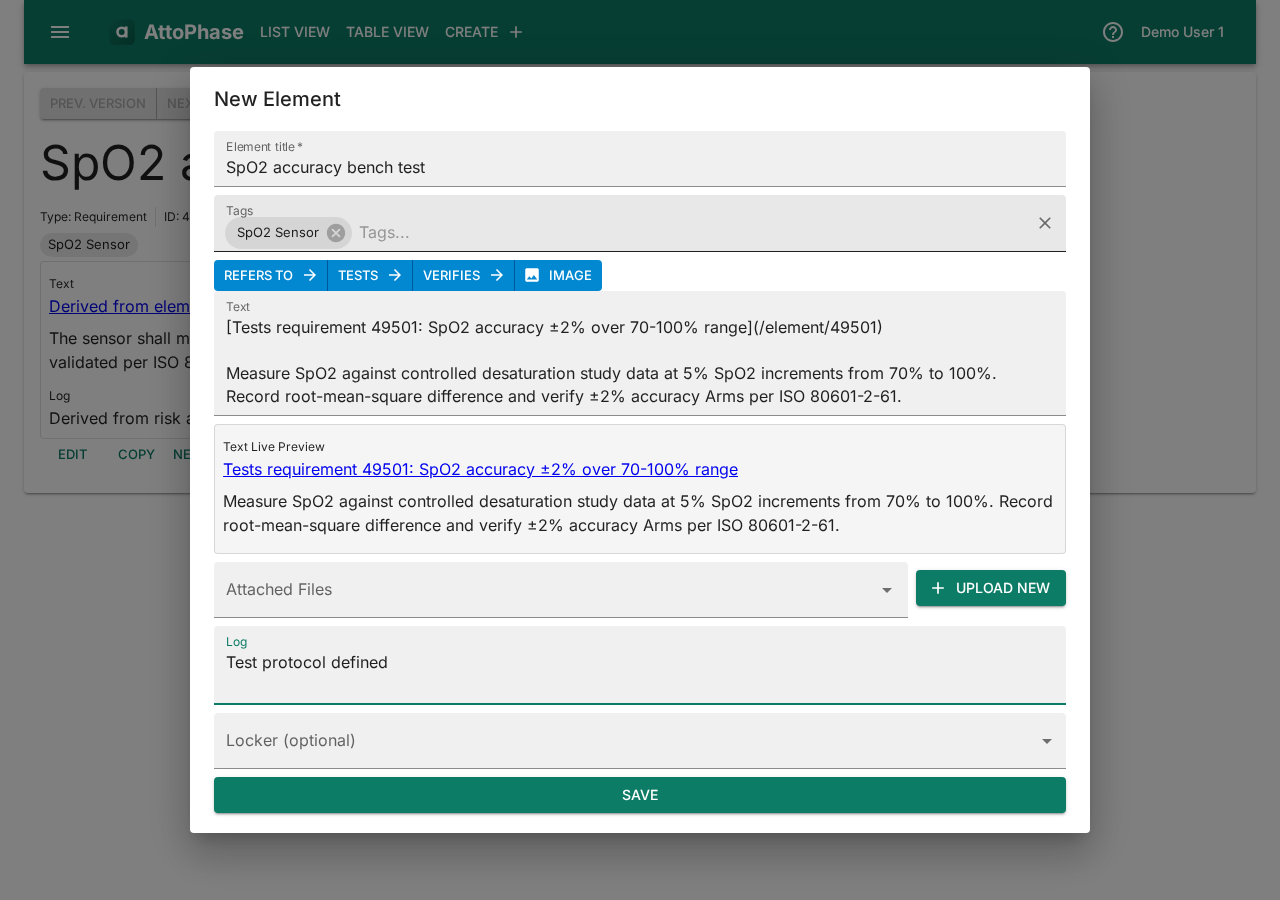
- Click Save. The test is created and linked to its requirement.
4. Recording a test result
After executing a test, record the outcome as a test result. The pass/fail status feeds into the traceability tables.
- Navigate to the test (e.g. "SpO2 accuracy bench test").
- Click New related element... > Define Test Result.
- Enter the result Name — e.g. "SpO2 accuracy bench test — PASS".
- Record the outcome in the Text field — e.g. "PASS — SpO2 Arms = 1.4% across 70-100% range. All data points within ±2% of ABG reference."
- Check or uncheck the Test Passed checkbox to indicate pass or fail.
- Add Tags and a Log note.
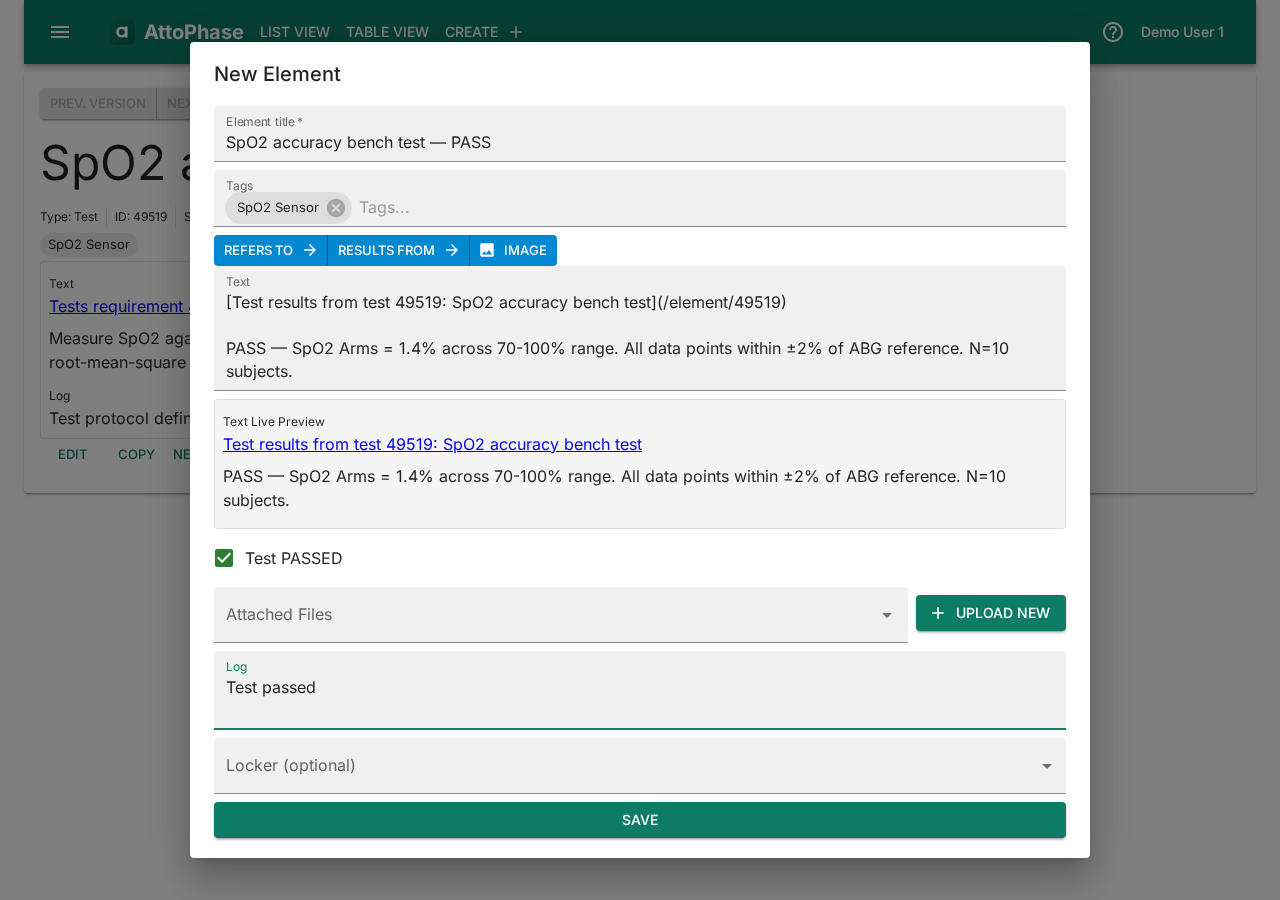
- Click Save. The test result is linked to its test, completing the traceability chain from risk through to test outcome.
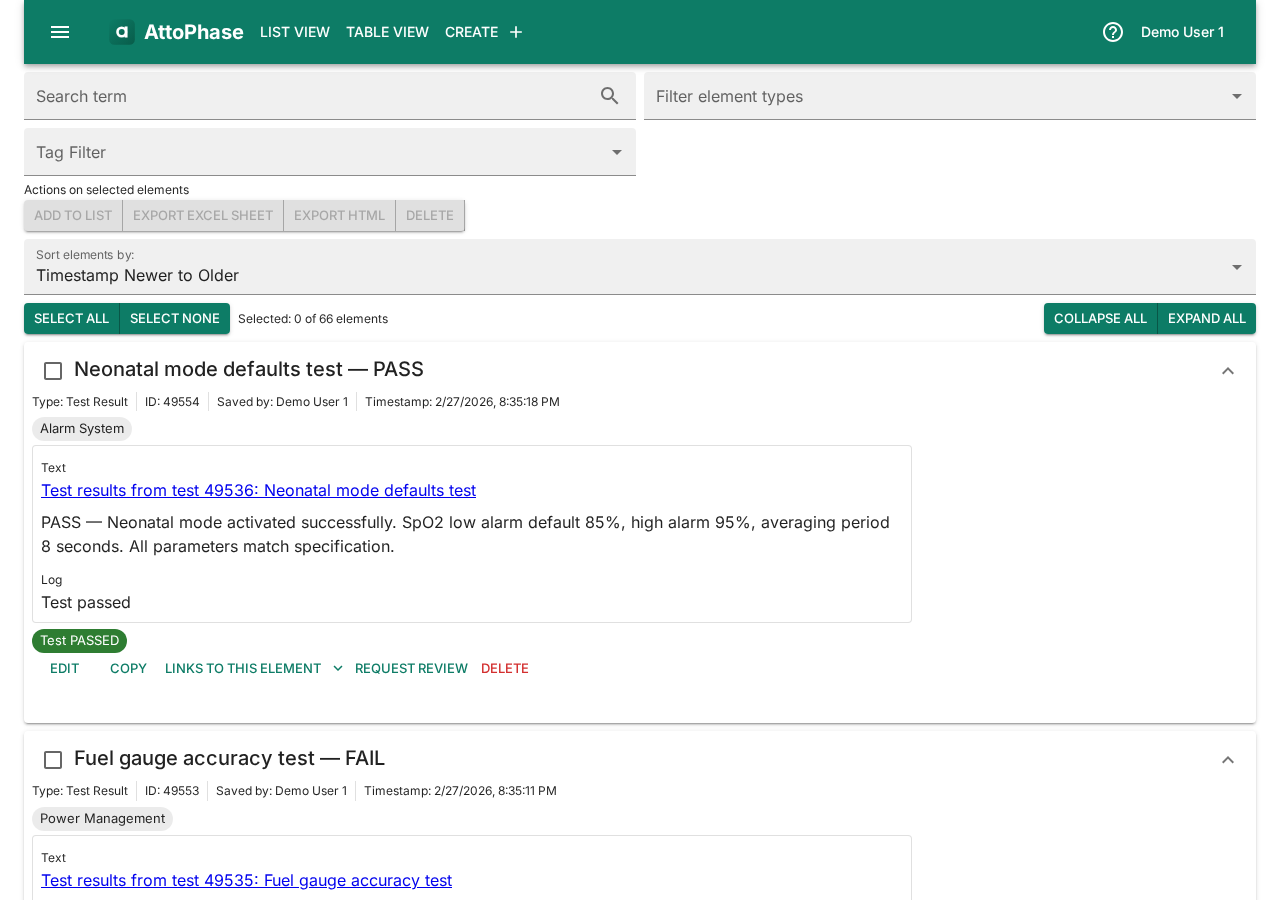
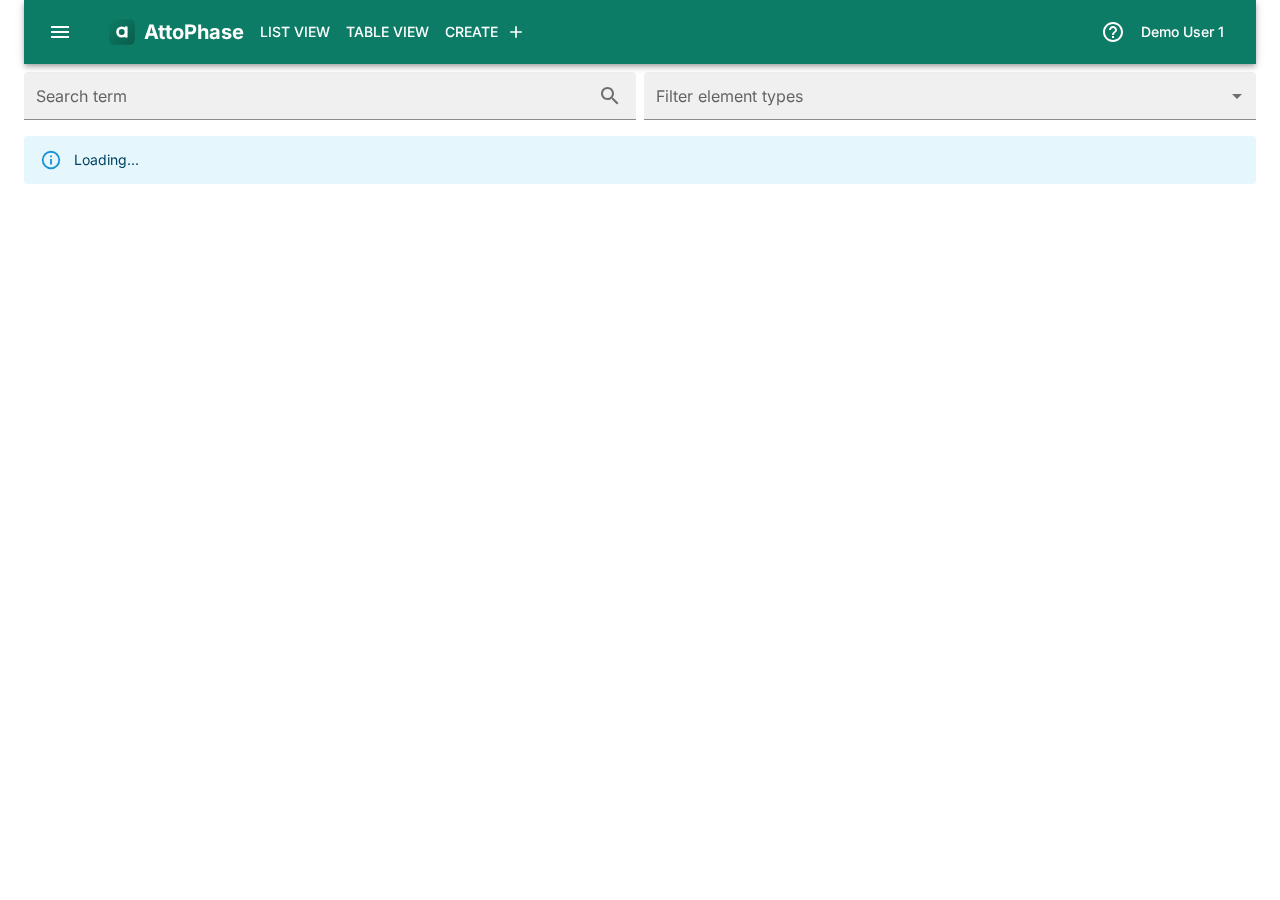
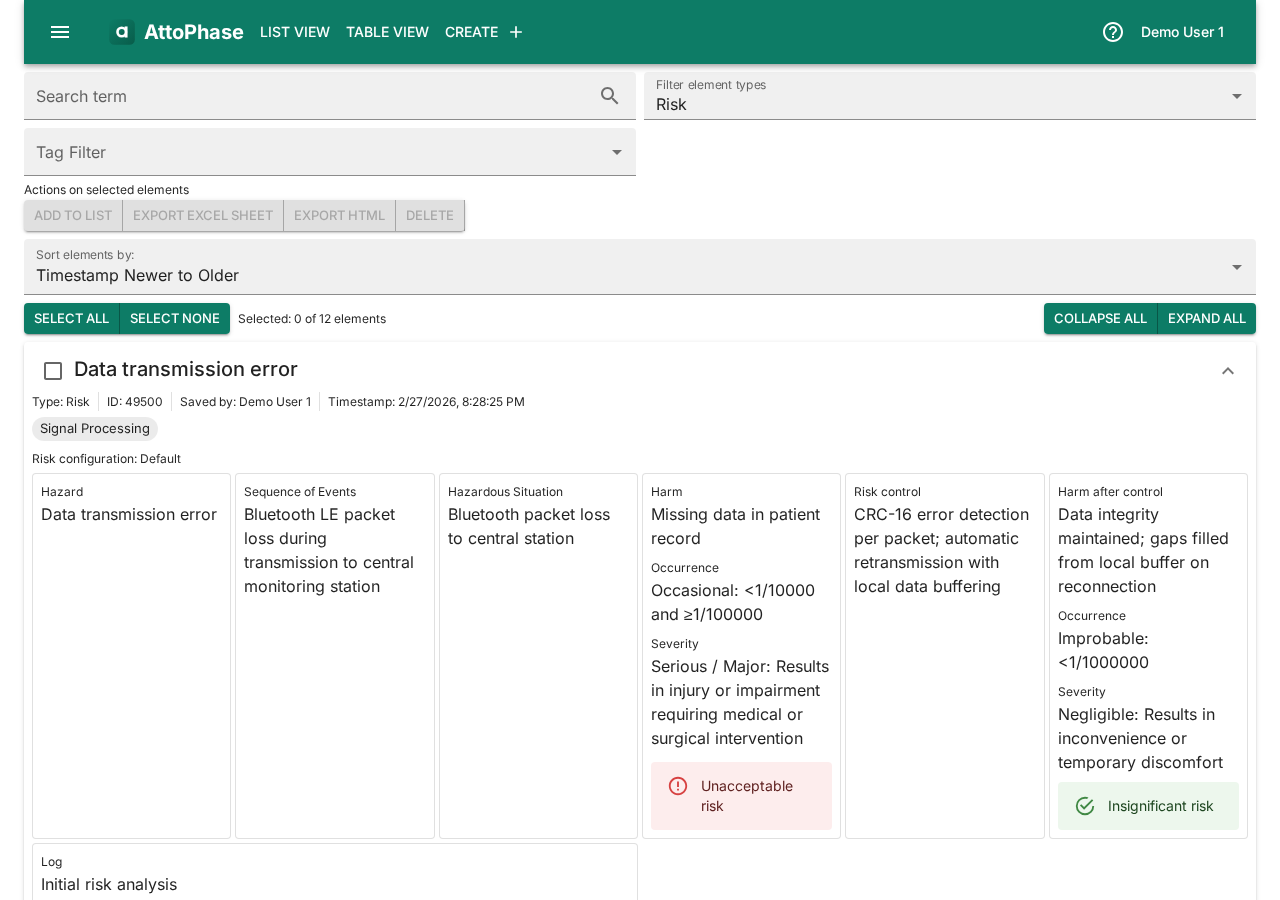
5. Viewing the element list
The element list shows all your items in one place. You can filter by element type and sort by date or title.
- Click List View in the toolbar to access filtered views for Requirements, Tests, Test Results, Risks, or All Elements.
- Click any element to view its full details, version history, and related elements.
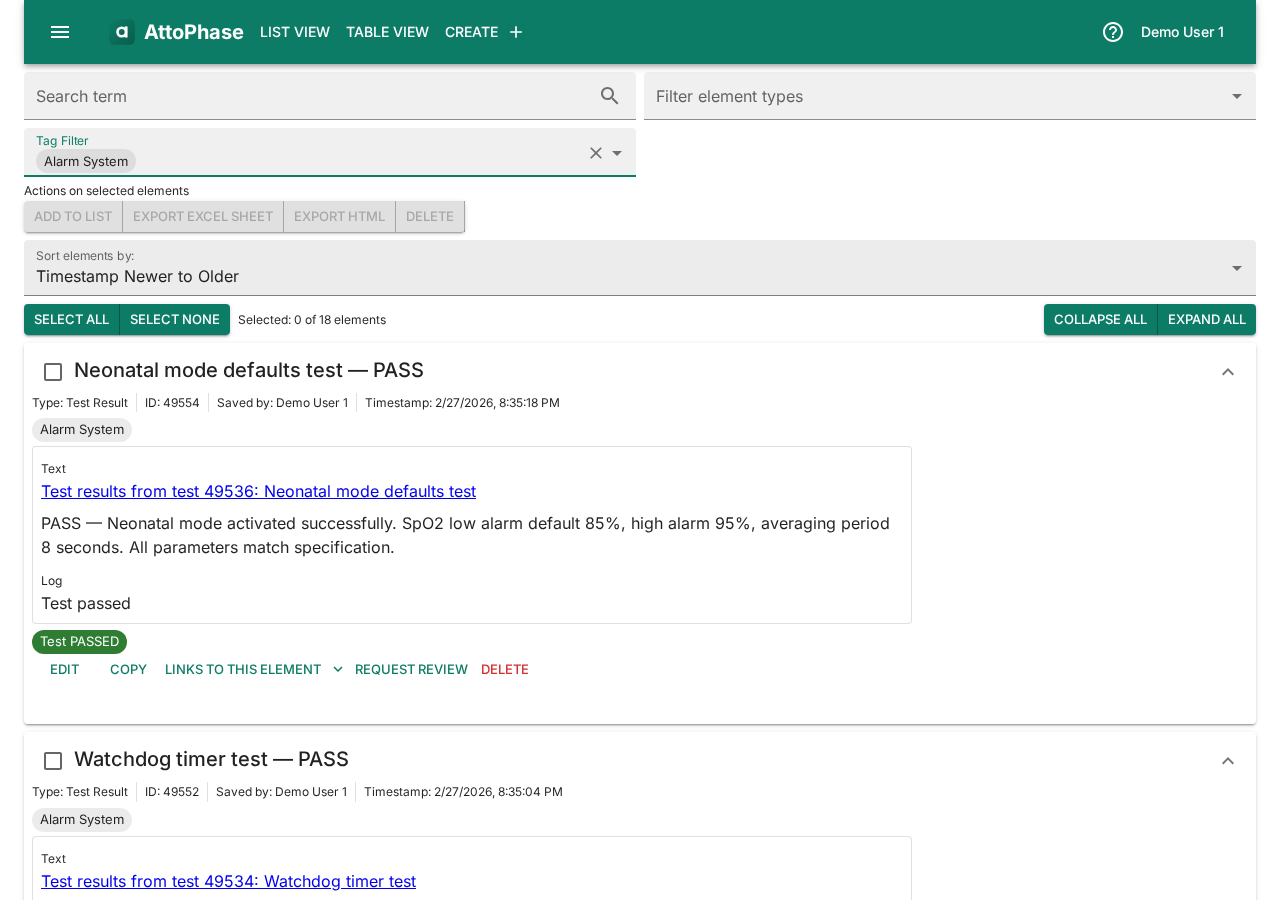
6. Filtering elements by tags
Use tags to narrow down to a specific subsystem, project, or category.
- On the element list, use the Tag Filter at the top.
- Start typing a tag name (e.g. "Alarm System") and select it from the dropdown.
- The list updates to show only elements with the selected tag. You can select multiple tags.
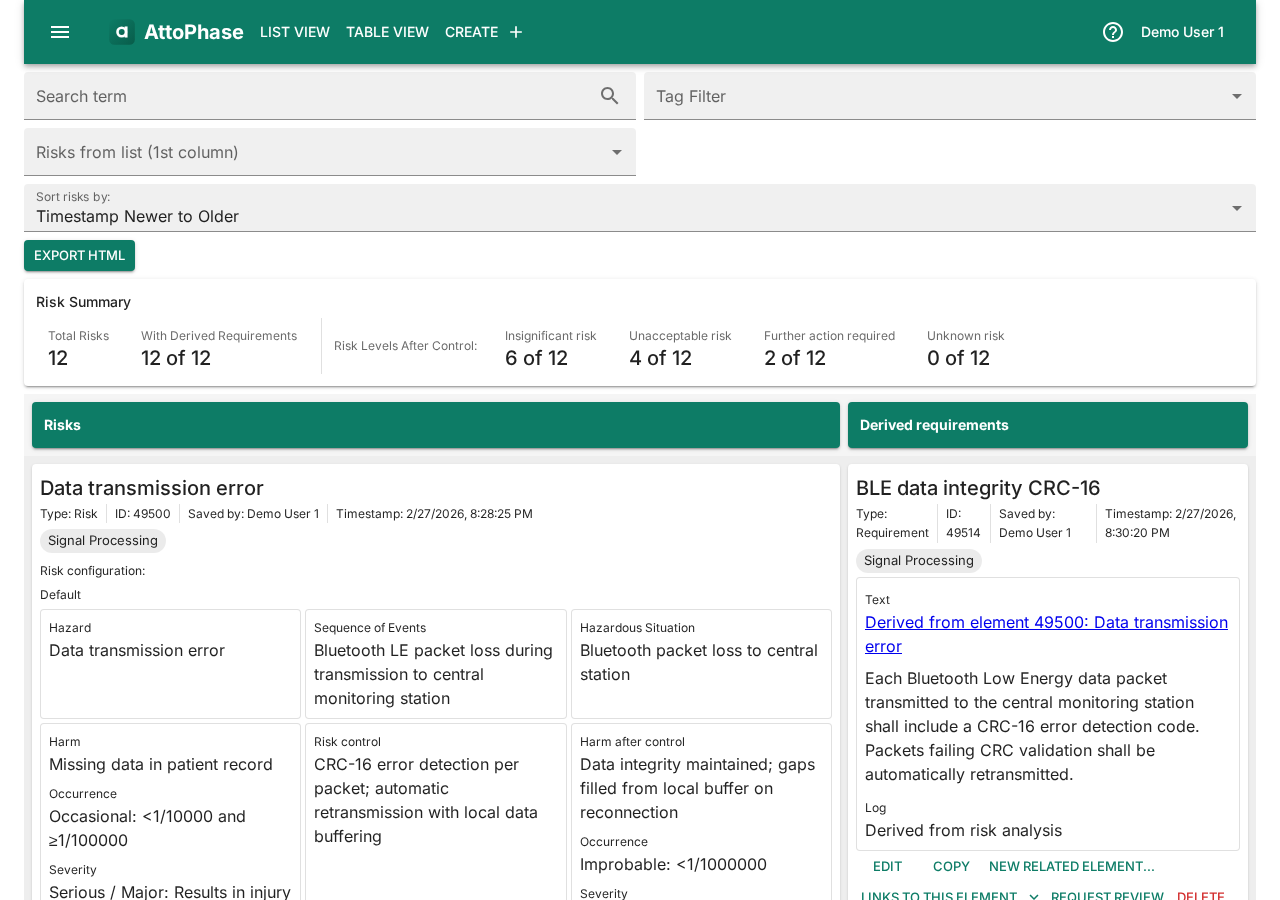
7. Risk-Requirement traceability table
This table shows how risks map to requirements, with risk levels color-coded for quick assessment.
- Navigate to Table View > Risk-Requirement in the toolbar.
- Each row shows a risk alongside its derived requirements. Risk levels before and after control are displayed.
- Use the tag filter to scope the view to a specific subsystem.
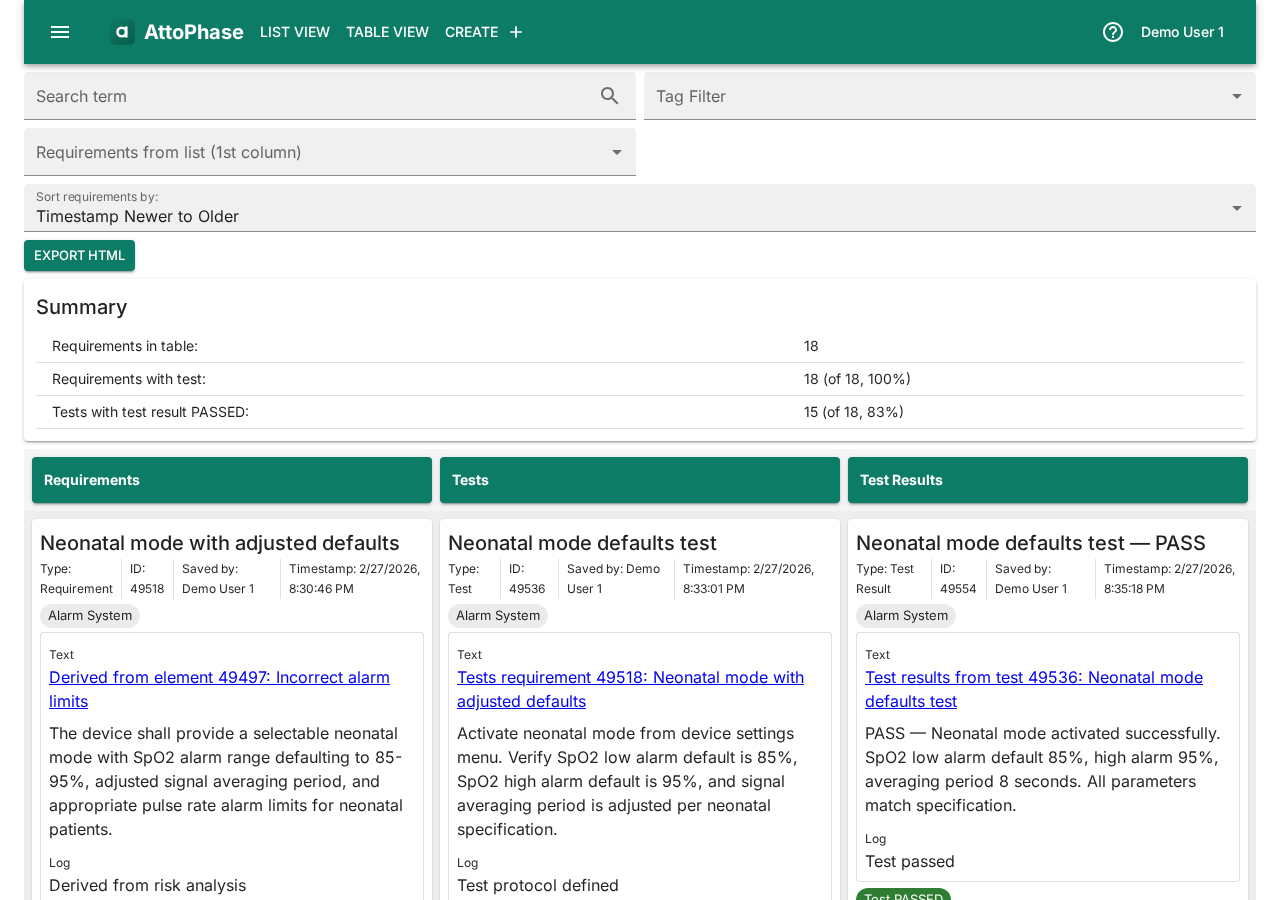
8. Requirement-Test-Result traceability table
This table traces requirements through tests to their outcomes, making it easy to see which requirements are fully verified.
- Navigate to Table View > Requirement-Test-Result in the toolbar.
- Each row shows a requirement, its associated tests, and the corresponding test results with pass/fail status.
- Requirements without tests or tests without results are shown with empty cells, making traceability gaps easy to spot.
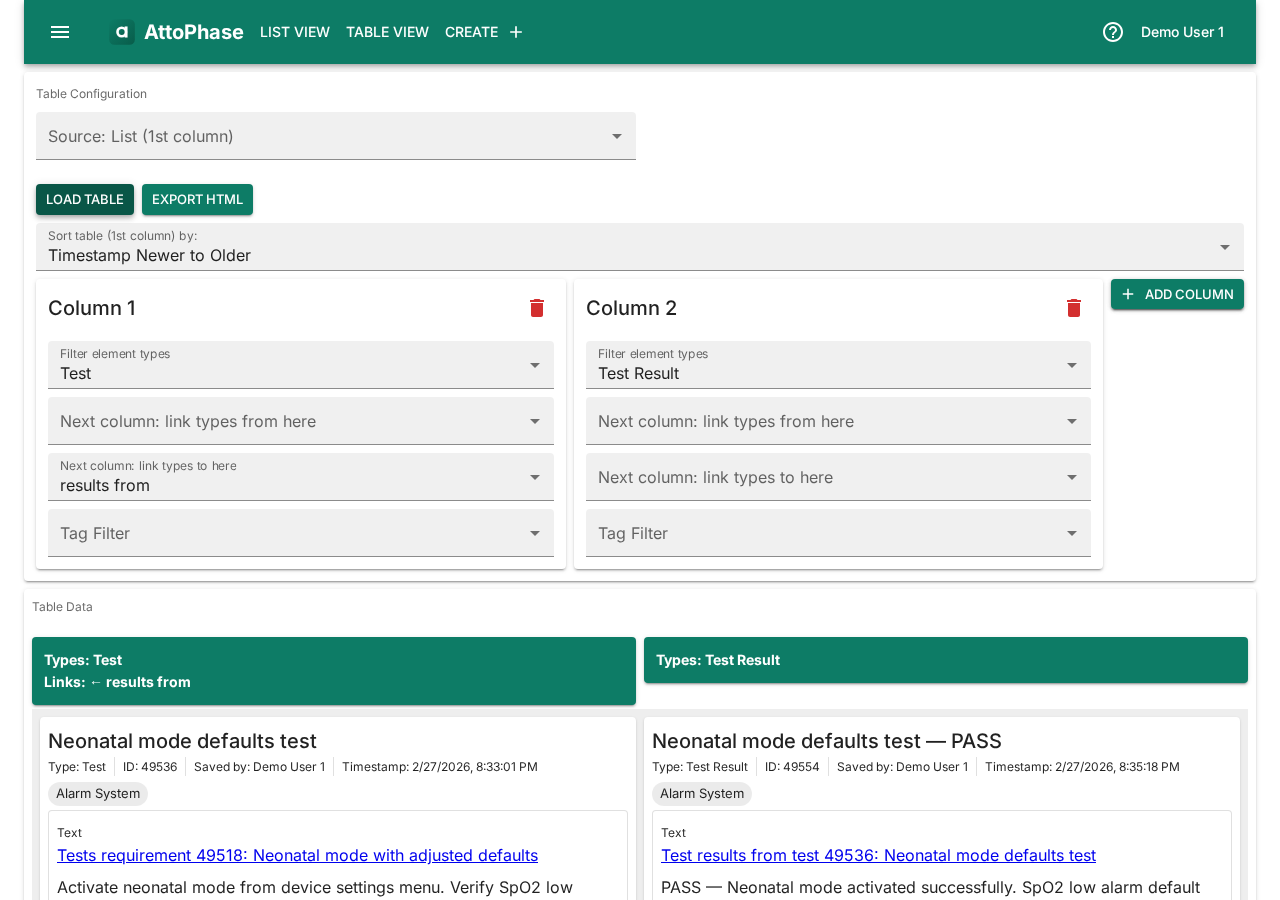
9. User-defined tables
User-defined tables let you build custom multi-column views that follow the links between elements. Each column filters by element type and tags, and columns connect through link types (e.g. "derived from" or "results from"). This is useful for creating ad-hoc traceability views beyond the built-in Risk-Requirement and Requirement-Test-Result tables. The example below shows one possible configuration — you can use any combination of element types and link types.
- Navigate to Table View > User-defined Table in the toolbar.
- In Column 1, set Filter element types to Test.
- In Column 1, set Next column: link types to here to results from. This tells the table to follow "results from" links — i.e. test results that link back to tests.
- Click Add column to create Column 2.
- In Column 2, set Filter element types to Test Result.
- Click Load Table. The table shows each test alongside its associated test results.
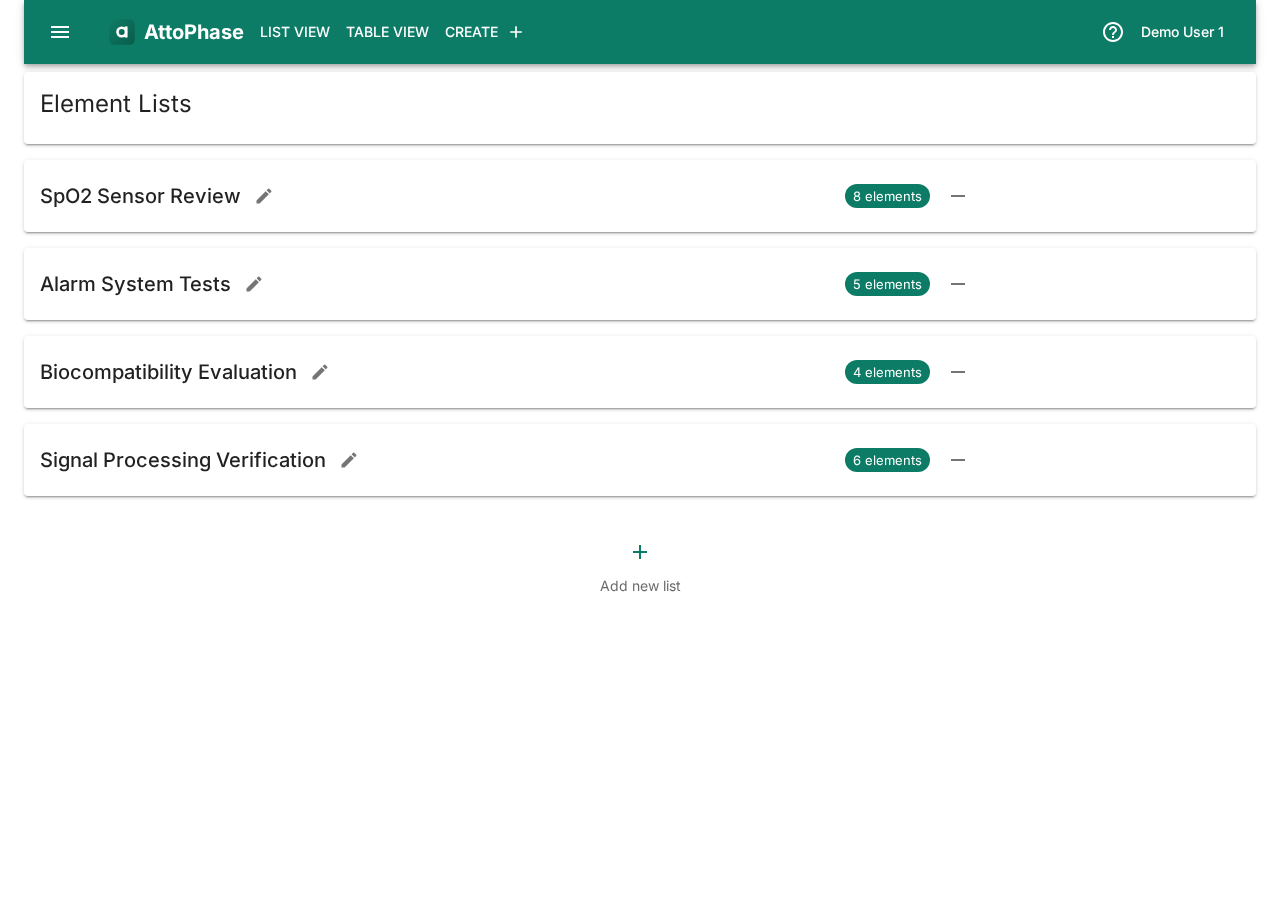
10. Saved lists
Element lists let you create custom, ordered collections of elements for focused work. Unlike type or tag filters, a list is a hand-picked set of elements that you maintain yourself. Lists are useful for grouping items for a particular deliverable, audit, or sprint.
- Open the side menu and select List Management, or click List View > Saved Lists in the toolbar.
- Click the + button to create a new list.
- Enter a List name and optionally assign a Locker (a permission group that controls who can view and edit the list), then click Save.
- Navigate to any element list or detail view. Select one or more elements and click Add to List.
- Choose an existing list or create a new one in the dialog.
- Open the list to see your elements. Use the arrow buttons to reorder, or the remove button to take an element out of the list.
11. Exporting elements to Excel
You can export any selection of elements to an Excel spreadsheet for offline review, sharing with external stakeholders, or archival.
- Navigate to any element list view (e.g. List View > All elements).
- Select the elements you want to export using the checkboxes.
- Click the Export Excel Sheet button in the toolbar.
- A file named
elements.xlsxis downloaded with columns: ID, Title, Element type, Tags, Text, Type Data (type-specific fields such as risk analysis data or test pass/fail status), Log, Timestamp, and Saved by.
12. Exporting risks to Excel
Risks can be exported to a rich Excel workbook that includes the full risk analysis with formulas, data validation dropdowns, conditional formatting, and supporting reference sheets.
- Navigate to List View > Risks.
- Select the risks you want to export.
- Click Export Excel Sheet.
- The downloaded
risk_analysis.xlsxcontains multiple sheets:- Risk Analysis — the main sheet with formulas for risk levels, data validation dropdowns for occurrence/severity, and conditional formatting for risk-level colors.
- Risk Levels — the risk matrix used by the formulas.
- Hazards, Severity Scale, Occurrence Scale, and Risk Level Definition — reference data from your risk configuration.
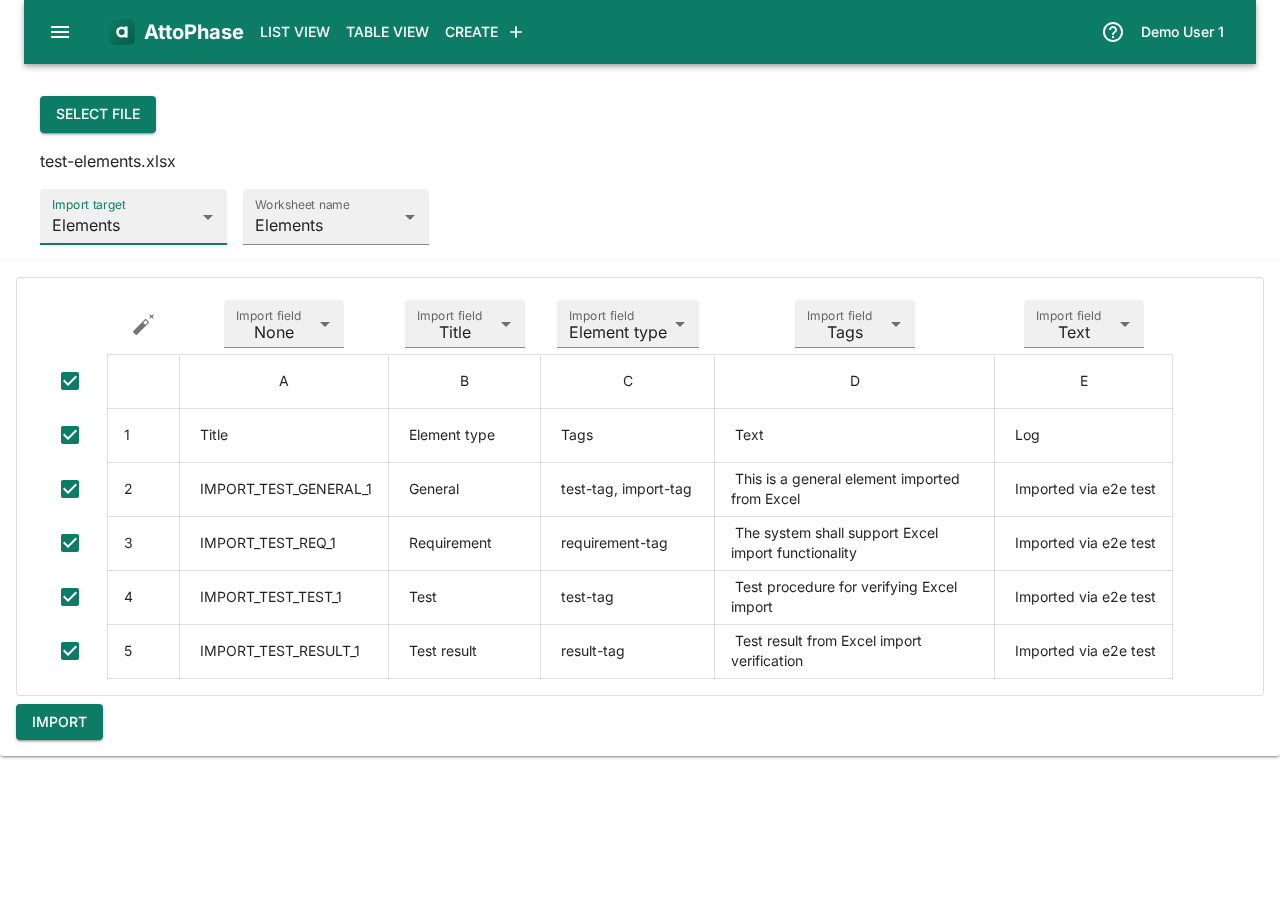
13. Importing elements from Excel
Import elements from an Excel file to quickly populate your project with existing data from another system or a previous export.
- Open the side menu and select Import.
- Click Select file and choose your Excel file.
- Set the Import target to Elements.
- Select the worksheet containing your data.
- Click the auto-map button (magic wand icon) to automatically match spreadsheet columns to element fields, or map them manually using the dropdowns.
- Review the preview table, then click Import.
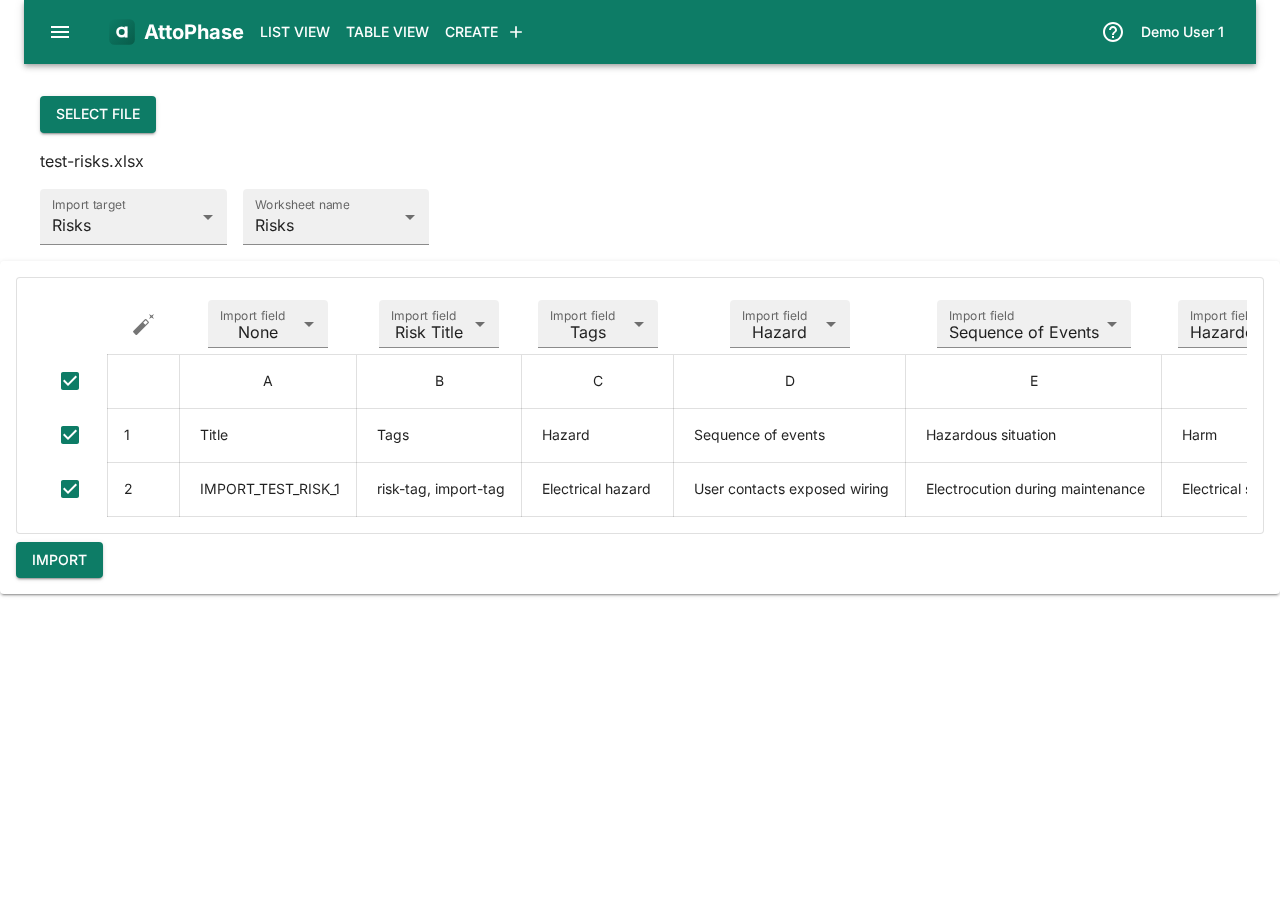
14. Importing risks from Excel
Risk data can be imported from Excel, including hazards, severity/occurrence ratings, and risk control measures. Occurrence and severity values are matched automatically against your existing risk configurations.
- On the Import page, click Select file and choose your Excel file.
- Set the Import target to Risks.
- Select the worksheet containing your risk data.
- Click the auto-map button to match columns to risk fields, or map them manually. If multiple risk configurations match, a dialog lets you choose the correct one.
- Review the preview and click Import.
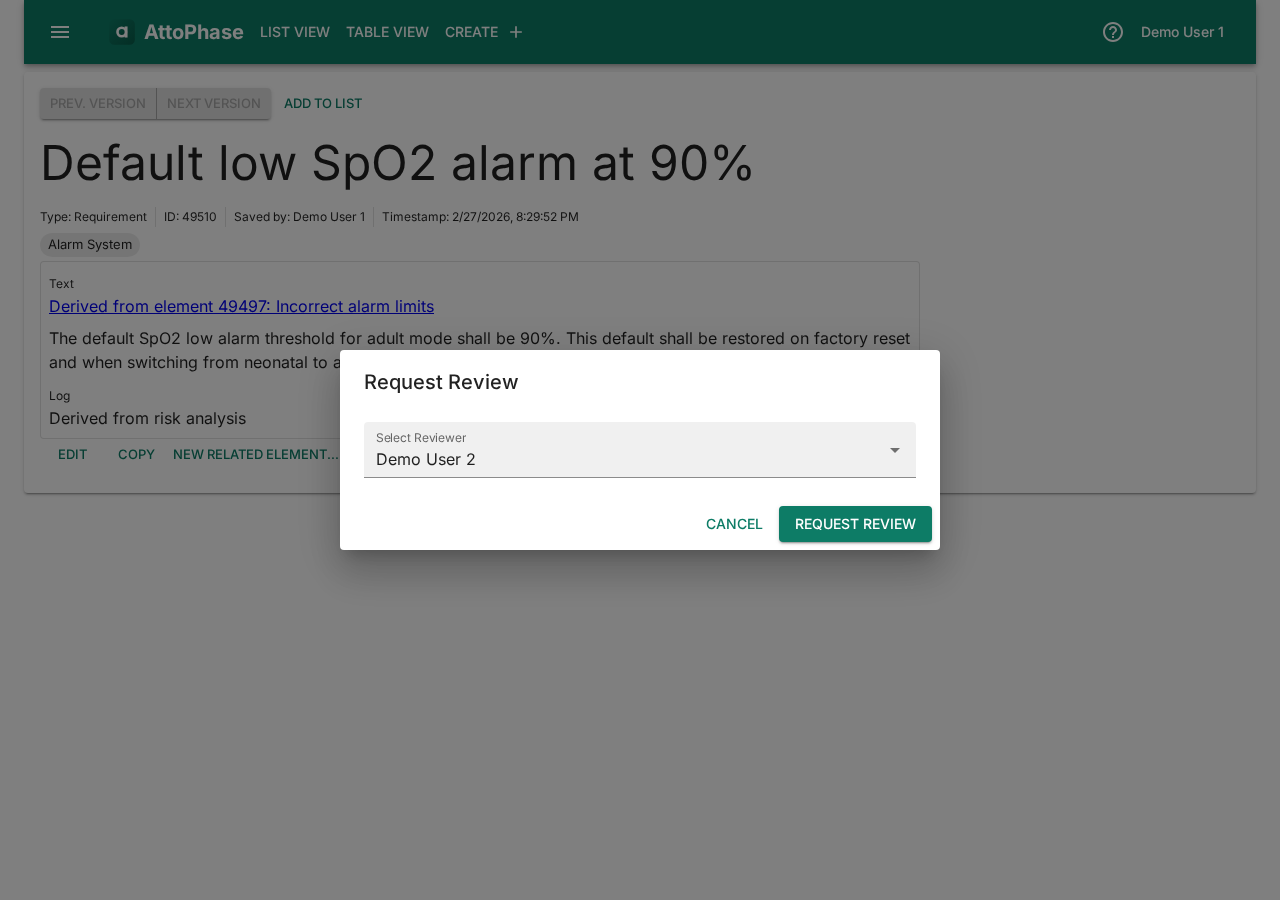
15. Requesting a review
Any element can be sent for review to another member of your organization.
- Navigate to the element you want reviewed.
- Click the Request Review button.
- In the dialog, select a Reviewer from your organization.
- Click Request Review to submit. The reviewer will see the pending review on their dashboard.
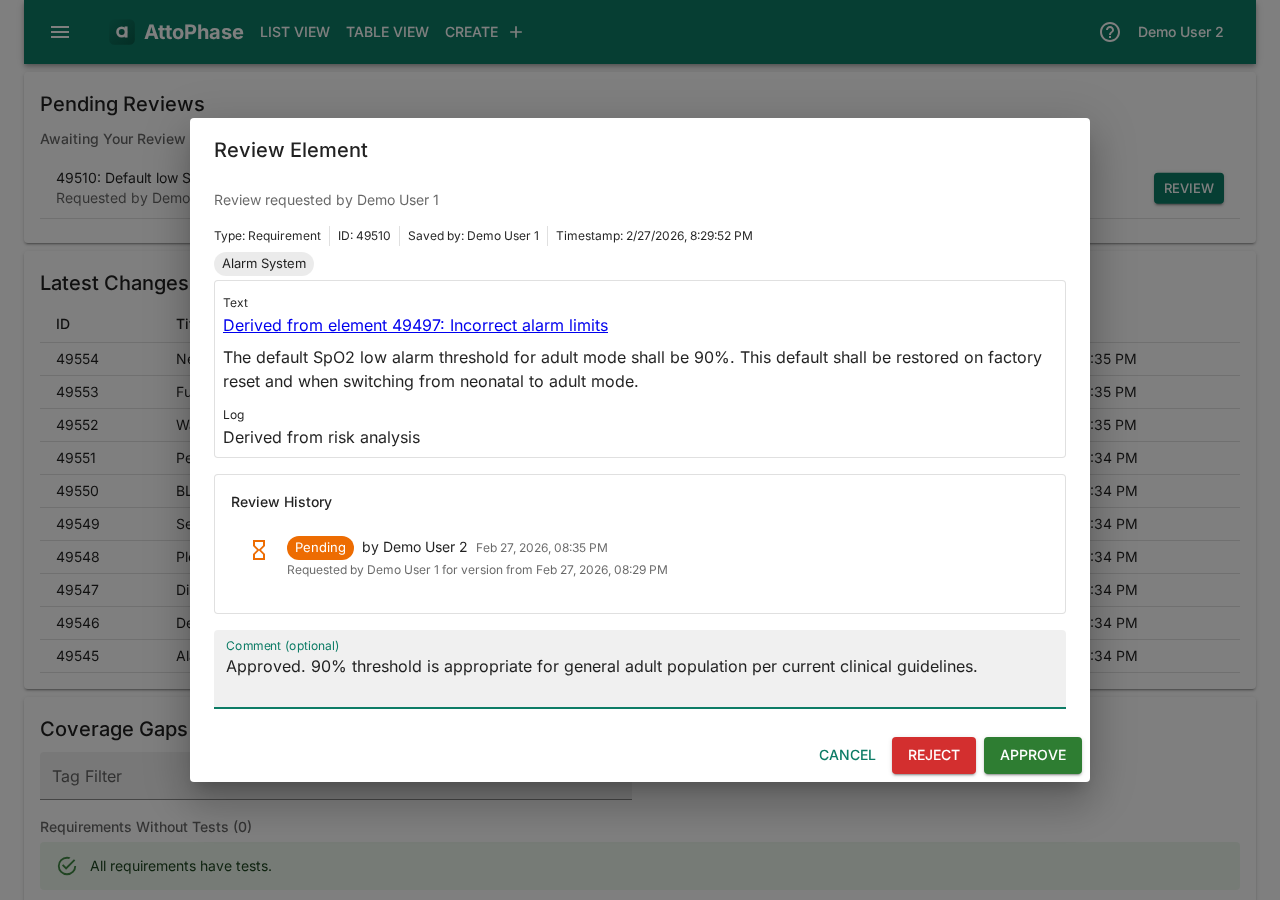
16. Approving a review
When you have pending reviews, they appear on your dashboard.
- On the dashboard, find the pending review and click Review.
- Read the element content and add a Comment — e.g. "Approved. 90% threshold is appropriate for general adult population per current clinical guidelines."
- Click Approve or Reject. The decision and comment are recorded in the element's review history.
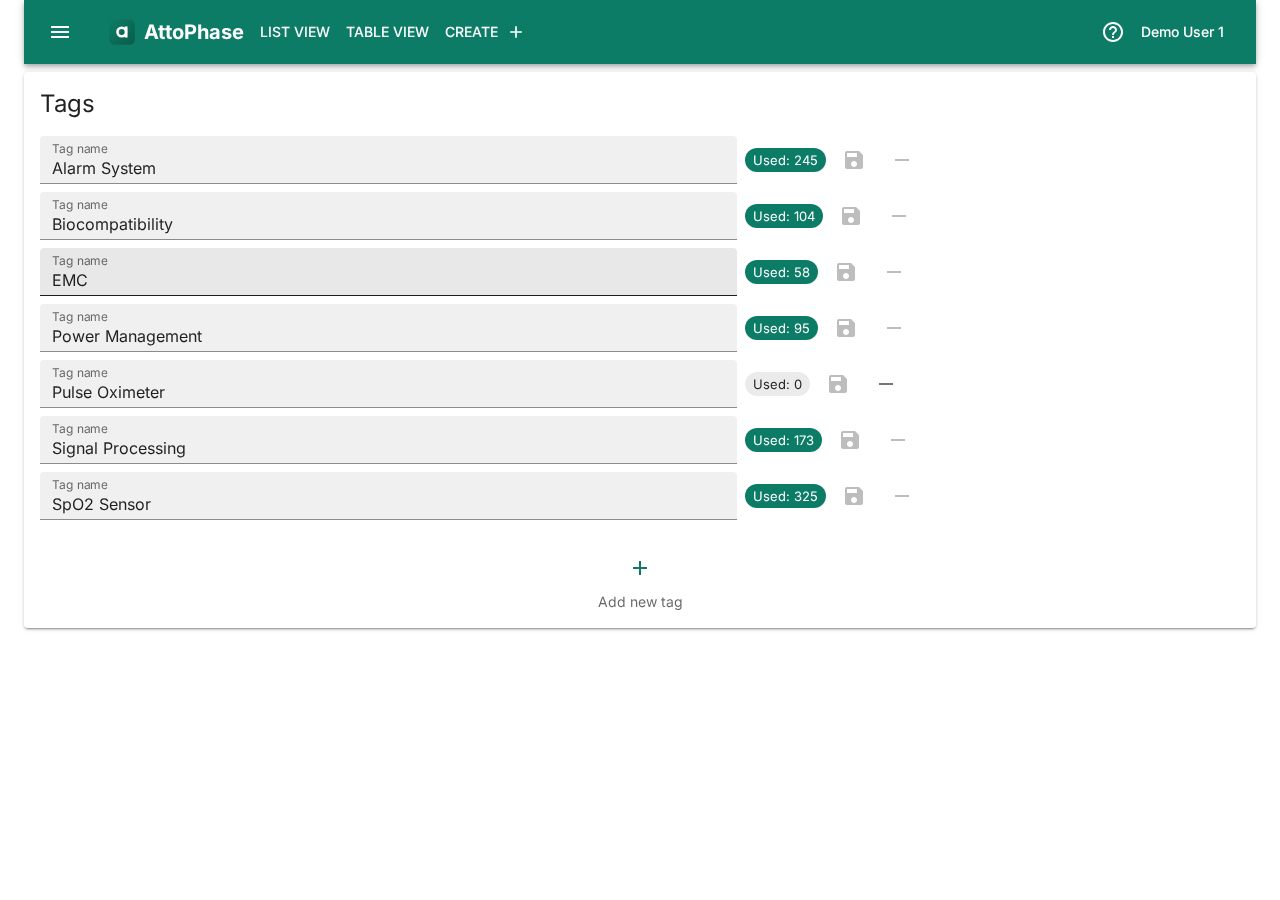
17. Managing tags
Tags let you organize elements by project, subsystem, or any category. They are used for filtering across all views.
- Open the side menu and select Tag Management.
- Click the + button to add a new tag.
- Enter the tag name (e.g. "SpO2 Sensor", "Alarm System") and click Save.
- Existing tags can be renamed or deleted from this page.
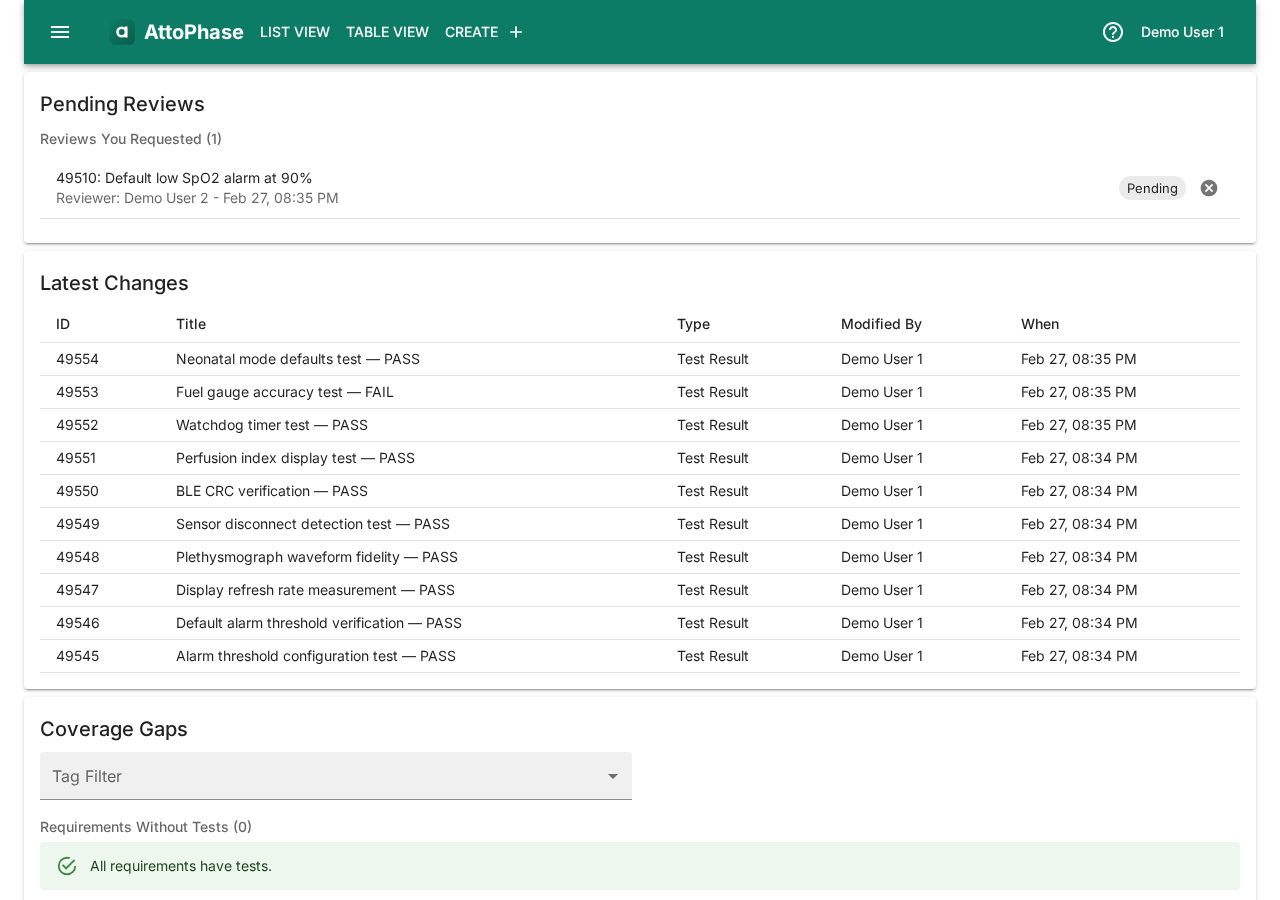
18. Dashboard overview
The dashboard is your starting point after logging in. It gives you an at-a-glance summary of your work.
- Pending Reviews — reviews assigned to you that need action.
- Latest Changes — the most recently modified elements for quick access.
- Coverage Gaps — a summary of traceability gaps: requirements without tests, tests without results, failed test results, and risks not acceptable after control.